-2

I am a JavaScript developer mainly, so I am familiar with object-oriented code and dealing with things you can see easily and interact with, like the GUI, even HTTP requests, etc. Plus you can put breakpoints around and inspect the object properties and such, or log it to the terminal, etc.

However, I would like to start getting good at Assembly. I have heard of GDB but have never needed to use it because I don't do any Assembly hardly.

I would like to practice by building things like (simplified) malloc, etc., plus simpler C stdlib functions like strcat and whatnot. Ideally, too, I would like to avoid using any built-in stdlib functions to help me in the debugging process (like using printf to print stuff out). If you ABSOLUTELY DO NOT recommend that I do that, that's one thing, but I would like to get a deeper sense of what it was like to be a programmer in the early days when the tools just didn't exist.

My question is, how did they debug this stuff when they were working on something like this Malloc I got from github:

has_initialized:
        .zero   4
managed_memory_start:
        .zero   8
last_valid_address:
        .zero   8
malloc_init:
        push    rbp
        mov     rbp, rsp
        mov     edi, 0
        call    sbrk
        mov     QWORD PTR last_valid_address[rip], rax
        mov     rax, QWORD PTR last_valid_address[rip]
        mov     QWORD PTR managed_memory_start[rip], rax
        mov     DWORD PTR has_initialized[rip], 1
        nop
        pop     rbp
        ret
free:
        push    rbp
        mov     rbp, rsp
        mov     QWORD PTR [rbp-24], rdi
        mov     rax, QWORD PTR [rbp-24]
        sub     rax, 8
        mov     QWORD PTR [rbp-8], rax
        mov     rax, QWORD PTR [rbp-8]
        mov     DWORD PTR [rax], 1
        nop
        pop     rbp
        ret
malloc:
        push    rbp
        mov     rbp, rsp
        sub     rsp, 48
        mov     QWORD PTR [rbp-40], rdi
        mov     eax, DWORD PTR has_initialized[rip]
        test    eax, eax
        jne     .L5
        mov     eax, 0
        call    malloc_init
.L5:
        mov     rax, QWORD PTR [rbp-40]
        add     rax, 8
        mov     QWORD PTR [rbp-40], rax
        mov     QWORD PTR [rbp-16], 0
        mov     rax, QWORD PTR managed_memory_start[rip]
        mov     QWORD PTR [rbp-8], rax
        jmp     .L6
.L9:
        mov     rax, QWORD PTR [rbp-8]
        mov     QWORD PTR [rbp-24], rax
        mov     rax, QWORD PTR [rbp-24]
        mov     eax, DWORD PTR [rax]
        test    eax, eax
        je      .L7
        mov     rax, QWORD PTR [rbp-24]
        mov     eax, DWORD PTR [rax+4]
        cdqe
        cmp     QWORD PTR [rbp-40], rax
        jg      .L7
        mov     rax, QWORD PTR [rbp-24]
        mov     DWORD PTR [rax], 0
        mov     rax, QWORD PTR [rbp-8]
        mov     QWORD PTR [rbp-16], rax
        jmp     .L8
.L7:
        mov     rax, QWORD PTR [rbp-24]
        mov     eax, DWORD PTR [rax+4]
        cdqe
        add     QWORD PTR [rbp-8], rax
.L6:
        mov     rax, QWORD PTR last_valid_address[rip]
        cmp     QWORD PTR [rbp-8], rax
        jne     .L9
.L8:
        cmp     QWORD PTR [rbp-16], 0
        jne     .L10
        mov     rax, QWORD PTR [rbp-40]
        mov     rdi, rax
        call    sbrk
        mov     rax, QWORD PTR last_valid_address[rip]
        mov     QWORD PTR [rbp-16], rax
        mov     rdx, QWORD PTR last_valid_address[rip]
        mov     rax, QWORD PTR [rbp-40]
        add     rax, rdx
        mov     QWORD PTR last_valid_address[rip], rax
        mov     rax, QWORD PTR [rbp-16]
        mov     QWORD PTR [rbp-24], rax
        mov     rax, QWORD PTR [rbp-24]
        mov     DWORD PTR [rax], 0
        mov     rax, QWORD PTR [rbp-40]
        mov     edx, eax
        mov     rax, QWORD PTR [rbp-24]
        mov     DWORD PTR [rax+4], edx
.L10:
        add     QWORD PTR [rbp-16], 8
        mov     rax, QWORD PTR [rbp-16]
        leave
        ret

I can imagine perhaps printing (using the Linux write syscall) individual bytes one at a time. But that's far from anything I could use to visualize better what is going on. I am used to being way higher level and seeing the objects in an intuitive level (functions, objects, variables, etc.). But here everything is just bits and bit sequences (8, 16, 32, 64, etc.).

What are the best ways of debugging this to aid in your workflow? How did others in the past do this when the tooling wasn't available? How can you take advantage of low-level tooling (perhaps, like GDB) to do this? (Should you use GDB)? Or can you whip together a reasonable debugger on your own using only Assembly to help you somehow? Nothing fancy, but enough to help visualize something.

The second part of the question is, what do I try to focus on? That is, what do I want the debugger to do that will help me be more proficient? I am not sure what a good debugger would even do at this level. Maybe it just prints out the whole memory layout? And I then dig through the hexcode with my eyes? Is that what they did? Or do you get more strategic somehow?

Or do you just simply need to be able to run the code in your head, and that's it? I can't think of much in between.

My use case for this is to learn how to do Assembly like the ancient people did. But another use case would be to build out an OS on a bare-metal raspberry, I'm not sure if debuggers would work there (but perhaps they do). Either way, I would like this.

4
  • 2
    How far back do you want to go? GDB was released in 1986 so it's a relatively modern tool. There were simpler debuggers in use well before that. Before that there were print functions and memory dumps printed on reams of fanfold pape. And before that there were toggle switches, single step buttons, and console lights to set and read the contents of registers. In the beginning was simply write out the program on paper and step through it in your head. Most of that is only of historical interest. It won't be particularly helpful in writing modern applications, other than learning the opcodes. Commented Jun 1, 2020 at 16:22
  • I guess I am talking either Donald Knuth when he was in college. Or perhaps bill gates, but I’m not totally sure. I would like not paper but simpler debuggers before gdb. Commented Jun 1, 2020 at 17:03
  • 1
    When Donald Knuth was in college computers were mostly almost entirely used in batch mode, no interactive sessions. It would have been writing and debugging your program on paper, then transcribing it to punch cards to be submitted for execution. Execution might have printed out memory dumps and debugging messages on paper. Bill Gates as a high school student would have also had access through a teletype, but most programs were still written and debugged on paper. In college he would have had access to interactive sessions through video terminals. Commented Jun 1, 2020 at 18:35
  • 1
    Honestly you're probably better off developing in C, then compiling and debugging than jumping right from Javascript to X86 Assembly. Commented Jun 1, 2020 at 21:13

3 Answers 3

4

how did they debug this stuff

Same as today. You divide the code into trusted and untrusted and pick apart the untrusted until you trust it.

How did others in the past do this when the tooling wasn't available?

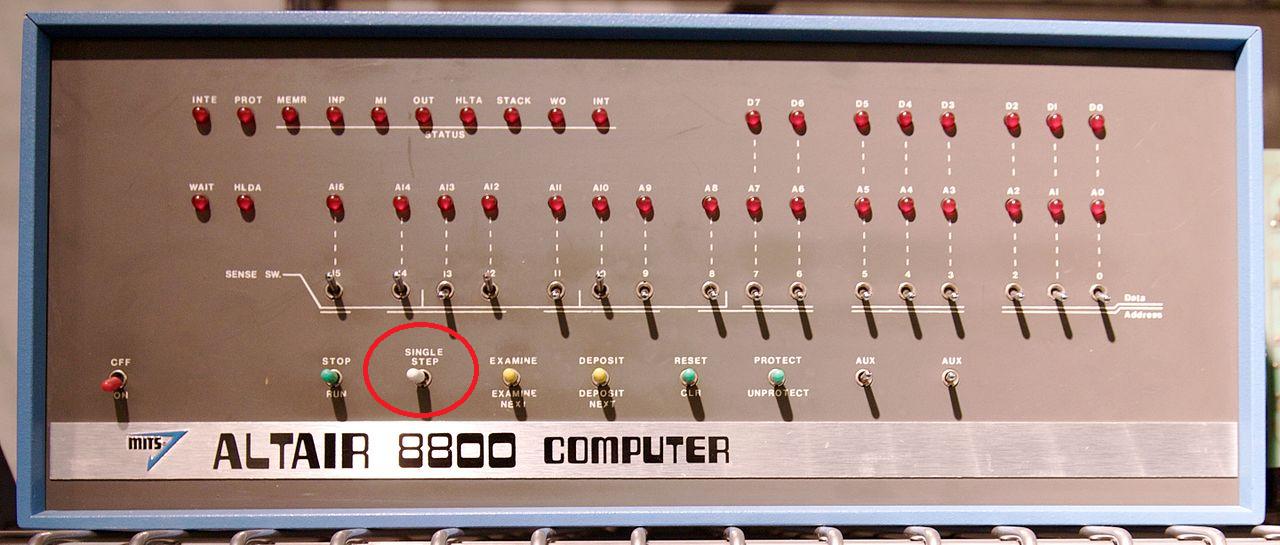
Tooling has always been available. It's just different tooling. Here's a blast from the past.

enter image description here

Note the highlighted "single step" control. Before we had software to help us debug we had hardware. Those lights on the panel aren't there to look cool in hollywood movies. They told us the state of the computer even when the output didn't. Testing was important enough that you could force the computer to stop on every instruction so you could write down its state.

You compared that to what you expected to see when you fed the computer known input. When state or output become unpredicted you stop trusting code.

Our tools and techniques have changed a lot over the decades but this pattern still holds true today. Just like us codemonkeys of old, I recommend you use every tool you can get your hands on.

1
2

Never debug.

First: understanding your code is better than playing with a machine.

Second: knowing that you can’t debugger your code will make you write perspicuous code in the first place.

Evidence / experience:

In the batch days - send the cards, get the printout. If it differs: think.

In CP/M days - starting with a Basic-only machine, write an assembler in Basic, poke the code into memory, call it. If it never comes back, think harder next time. The end result was writing a whole BIOS, and indeed when it was put together with the rest, this Basic-only machine (Pertec PCC2000) was running CP/M.

On the 6502 - the Rockwell AIM65 had a thermal printer with lovely timing loops to get the dots in the right place. Rewrote it to be interrupt-driven (and twice as fast). Undebuggable by definition. Admittedly burned out one driver transistor doing it - but only one. Smoking transistors are a powerful incentive to get it right.

None of this is heroics. It is how things were done normally. Debuggers make bugs.

Don’t debug - think.

2
  • 1
    Easy for you to say, but most of us mere mortals have to debug at some point. Commented Jun 2, 2020 at 15:55
  • 1
    I feel compelled to point out that debugging isn’t simply using debugging software. Sometimes it means looking at printouts, calculating state by hand, staring at the tile in your shower while thinking, and even crawling through equipment to remove bugs. Commented Jun 2, 2020 at 16:06
0

There were other debuggers before gdb e.g. IBM symbug, but I think they were all fairly similar. The only simpler approach is printf statements. Before that it was stacks of punched cards or paper tape. gdb works on other gnu compiler languages if you want to try it for those.

Your Answer

By clicking “Post Your Answer”, you agree to our terms of service and acknowledge you have read our privacy policy.

Not the answer you're looking for? Browse other questions tagged or ask your own question.