20

I understand using bookmarks to remember a single point in your code. However, how does one keep track of the flow of the code they are investigating? Eg: multiple bookmarks and the order in which they were made.

Example:

  1. Bug report: "Collisions aren't working on the corners of walls"

    1. Reproduction of the bug puts it down to certain polygons not colliding.
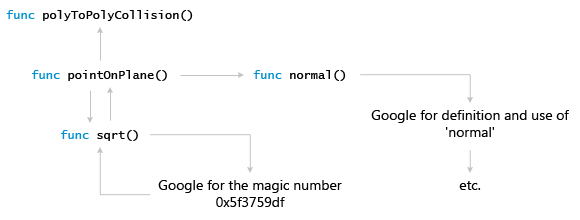
    2. The collision code was written by an unavailable dev. So investigation goes something like:

Schema of a flow

During the investigation, especially when reviewing non-code items such as Google, one may reasonably be expected to loose their place in the code (Have I already looked at this code path? or Which code path was I investigating? There are multiple that lead to this function, etc). The same goes for unavoidable interruptions (Boss: I need [Lengthy Pointless Report] NOW, etc)

It would be useful to have a resource of techniques or tools for providing a way to keep track of one's place in the code.


Edit: The above example is meant as a potential illustration, not as an actual problem that needs answering.

Another way to phrase this question is:

When learning a new system, how do you keep track of where you are up to in learning the code? It's not about understanding why the code does what it does (which is what comments should be for), but how it does it (which is only learned through reading the code, not comments).

0

9 Answers 9

13

The bubbles interface attempts to solve this problem by showing a bunch of bits of code at once. (You're stuck with your browser for Googling). It looks amazing but I haven't tried it. This version of the idea is a Visual Studio implementation for Visual Studio Ultimate.

4
  • +1 as this is a practical and ready-now solution to the problem. (It's also just a little bit awesome!) Commented Sep 29, 2011 at 1:28
  • One of the things I invented in my head years ago, just to find out it exists already :( +1
    – phresnel
    Commented Oct 2, 2011 at 5:32
  • seems similar to what you can do in Squeak and other Smalltalks where you open new code browsing windows and you can navigate to whatever methods/classes you want in them.
    – user7433
    Commented Oct 13, 2011 at 18:15
  • pretty awesome...I had created a little toy app that provides a visualization of your internet browsing in a similar manner (as you click links, a new node would be added and linked back to the origin). Never thought of applying that to code visualization. Commented Dec 8, 2011 at 22:50
12

Aside from all the great technologies mentioned, I've found that the old-fashioned A3 piece of paper is an excellent help in these issues. Write down your ideas and organize them mindmap-style.

1
  • Yep yep. Best answer by far. Commented Dec 8, 2011 at 19:22
10

Both my editor and debugger can jump to a function's definition and have a multilevel "back" button like a web browser to return where I was before. That's usually sufficient for me to keep track of a complex debugging flow. It also helps to have source control that lets you commit a lot. That gives me a commit message explaining why I'm trying something, as well as a quick way to back out the change if it doesn't work. Other than that, a simple whiteboard to list potential and explored leads fills any remaining gaps for me.

5
  • 1
    Very practical. I hadn't thought of using source control in this way. Commented Sep 29, 2011 at 1:31
  • Which editor and debugger? Commented Sep 30, 2011 at 14:28
  • Vim and Green Hill's MULTI debugger. Commented Sep 30, 2011 at 14:43
  • In Visual Studio it is CTRL+- to go back and CTRL+= to go forward.
    – VitalyB
    Commented Sep 30, 2011 at 17:00
  • Eclipse can show the definition of the current symbol under the cursor in a separate panel.
    – user1249
    Commented Dec 8, 2011 at 21:36
3

Multiple ways that I keep track:

  • Write it down. Got a meeting in two minutes? Write down what you were doing and where. I always have pen and paper laying next to me to write things down as I code.
  • Bookmarks. I have 10 numbered bookmarks I can set.
  • Stacktrace. You can easily view the whole hierarchy of code you went through. My editor also allows me to copy the stack trace and save it. The next time I open my editor I can load the stacktrace for fast navigation.
  • Editor navigation. Go to base member, go to inheritor, find usages, go to reference,...
1

I use the simple solution - never close anything until I am finished with the task. That means that usually one of the 50 or so open windows/tabs has something in it that will remind me what I was thinking when I get back to it.

2
  • The issue with this approach tends to be how do you track multiple concurrent branches of thought / research? Commented Sep 29, 2011 at 1:29
  • 1
    I don't find that to be a problem - they are all open in much the same way, and it doesn't matter all that much which branch I get back to. This works better for the web browser than the IDE, but that may just be because my current codebase isn't really organized conceptually. Commented Sep 29, 2011 at 1:34
1

Get a real developers tool / IDE, what ever takes you fancy. Vi, Emacs, Eclipse or whatever (The choice is as large as the arguements over which is best, but thats another problem), and learn to use it properly. dont, like too many do, use it like Notepad with syntax highlighing. Learn to use hotkeys, and not rely on the mouse for common actions (It's too slow). A big screen (1920x1200 minimum) is benficial.

My dev tool has named (Slower but useful names make them persistant) and unnamed (Quick to insert and delete) bookmarks, forward and back browsing and reference look up all in one, todo and developer (personal and group wide) notes attached to a particular line of source code. It does every language under the sun, without having to install yet another plugin.

I work on a code base consisting of a dozen or more 1 Million plus SLOC modules, using half a dozen languages. Obviously I don't work on all of them at a time, rather focus on small parts of one or two, but I can navigate with a few actions to any point in the code that is relivent to what I am doing.

6
  • I agree a proper IDE is best. I use vim's great marks and tag jumping features. However, they both have limitations: marks are buffer-local, and tag histories are linear. For complex situations, this still is not enough (hence asking this question). Commented Sep 29, 2011 at 11:47
  • 1
    I am a Vi amature, but have seen what can be done with it in the hands of power user who's prepared to write a few short scripts, spend some time to learn to really use VIM, or change to a tool that has features setup in a way that works for you, and spent time learning that. Thats my point. Learn you tools. A good tradesman does not blame his tools, niether does a good programmer.
    – mattnz
    Commented Sep 30, 2011 at 6:10
  • Agreed. I am an advanced beginner with vim (can use without thinking most of the time, but have barely scratched the surface), so I am sure there are things I don't know. Even still, I don't imagine it's possible to do anything such as psr's answer in vi(m) (at least, not from my research). Commented Sep 30, 2011 at 6:28
  • @Jess: marks are not necessarily buffer local. Marks using capital letters are global.
    – Dave Kirby
    Commented Sep 30, 2011 at 15:59
  • @DaveKirby Awesome - I love learning new things about vim :D Commented Sep 30, 2011 at 23:02
1

With Visual Studio, in a debug session, you can use the 'Call Stack' window (you can enable it in Debug / Windows / Call Stack or with the shortcut Ctrl+Alt+c) to track of the flow of code.

1
  • 1
    As in most debuggers. The question is more along the lines of when manually browsing your code including research outside of your code base. Commented Sep 29, 2011 at 2:21
1

I'm surprised no one has mentioned the many tools that can create call-graph plots. I've found doxygen to be a great help. You don't even have to commit to using doxygen throughout your program, you can just tag the functions you are interested in tracing.

0

I use org mode for emacs, which is an uber-outlining tool. With it, I can write an outline which mimics the call stack of the code and include direct links to the source code itself (via org-store-link). You can include explanatory text, links to web pages, etc. (e.g. when you google for magic numbers)

It's not perfect. For example the outline structure doesn't have any notion of going back up a level, so it's difficult to trace an execution path, as opposed to just a stack. But it's the next best thing to diagrams on paper that I've found.

Your Answer

By clicking “Post Your Answer”, you agree to our terms of service and acknowledge you have read our privacy policy.

Not the answer you're looking for? Browse other questions tagged or ask your own question.